I know it’s been brought up in other conversations… I was hoping with the algorithm update we’d see some improvements to vertical speed, but it still seems like the vertical speed being shown on the graph is actually an average of the speed over ~20 seconds or more. All my charts look like this.
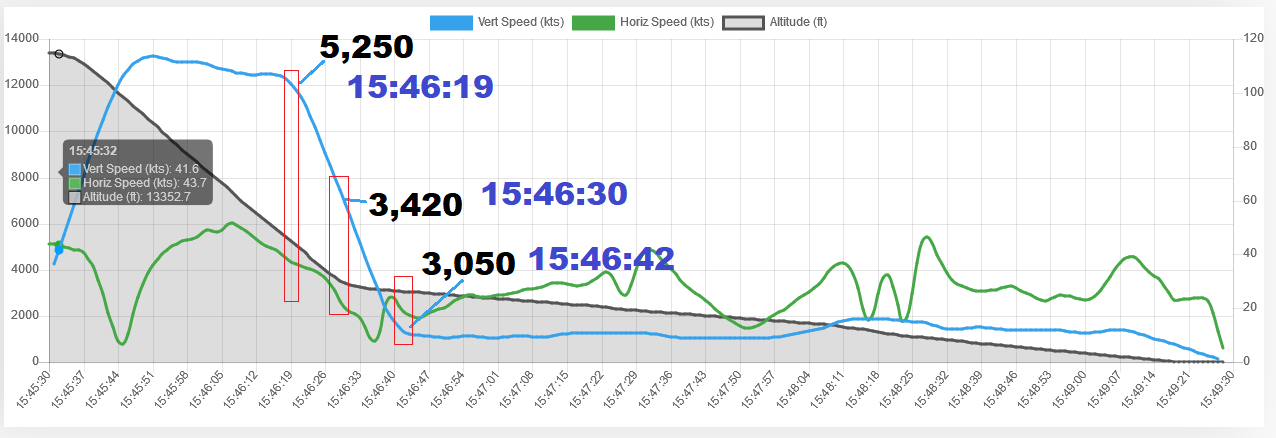
According to the data presented, I start slowing down at 5,250 feet (I deployed my PC at 4,000). I finished slowing down at 3,050 feet, 23 seconds later. I’ve put red boxes that cross the altitude graph so you can see the clear, true slow down that happened as my chute was fully inflated.
Why this matters: When I do a dive where I’m specifically working on fall rate, this should be reflected in the graph. I should be able to see fast fall vs. slow fall, and be able to reasonably ascertain what my actual fall rate is. I should be able to use my data to compare and contrast fall rates for different jump suits.
Data geeks unite! Any time the slope of Altitude line is steady, the slope of vertical speed should be zero. Any time the slope of Altitude is changing, the vertical speed should be non-zero.
Thoughts?
Also - has anyone solved this offline? Pull the file and crunch the data themselves?
@Roofstomp can you give me the Action ID of this jump in particular? I know you said all of your jumps but having this feedback ready to go is great, I can feed it directly back to the devs and they can use it as a case study
@Roofstomp No update as yet, it has been fed back to the dev team but they work based on priority of task, this will be looked into when more pressing tasks are complete. I will let you know when I have an update
Please see my post on the altitude graph and the speed graphs not being properly aligned. I believe that what you are posting about may explain what I posted about. The speed graphs need to be properly aligned with the altitude graph in order for any of the graphs to make any sense, but you are right that my graph shows my vertical speed decreasing over about 20 seconds (about five of which are tracking). It’s as if the graph is being stretched during freefall which is then causing the rest of the graph to be off.
 It’s 227053 - I clicked Mark for Review in case that’s helpful.