Using Dekunu to dial in box pattern

I want to use Dekunu data to estimate my average zero wind descent rate, and average zero wind horizontal speed.
My goal is to use wind direction, wind speed, the two averages, Google Maps, and math to create a better planned box-pattern.
Does anyone have insight into how to estimate these two averages? Best practices?

I am post-AFF, but I have not earned my A-license yet.

Respectfully,
Aaron

2 Likes

Hello & welcome to the forums.

Oddly enough, pattern clean-ups and landings was my primary purpose for acquiring the dekunu. There are some ‘quirks’ they are still working on, but for the most part, the rest of it is straight forward.

The tricky part is “estimating zero wind” during non-zero wind days.

I live in a windy area, so I fly one direction straight (follow a road) for 1000ft of descent, then turn around and follow the exact path back for another 1000ft of descent.
Dekunu Cloud will show you how much altitude you lost, at various points in time, each direction, as well as the ground-speed at each moment in time.

Decent Rate should be the same either direction. Variables will be steering & wind gusts & shifts, as well as thermals. Mine are all over the place…but after a few tries, they will be obviously centered around a given number. Or, choose a spot/plot altitude on one end of the run, and another altitude on the other end of the run, and can run basic math against those ($start - $stop)/ $seconds …one of my canopies is very close to 1000ft descent per minute.

Ground Speed is similar, all over the place, based on the variable non-zero-wind conditions. Similar to above, but you need 2 averages, one from each direction, then add them together and divide by two. Yes, the non-zero-wind is possibly different at the different elevations, but it gets you something.

If you have real honest-to-goodness zero-wind to work with, then this exercise becomes simple!

That’s for the math. Have fun with it! :upside_down_face:

The easy way part is that Cloud Web gps mapping will show you just how clean or how messy is your landing pattern to begin with. If it’s nice and clean, then you can look at the map and know where to shift it…so to to land exactly where you want next round. You’ll see where you started the pattern, and where you landed. So you shift the start point to compensate. Rinse, repeat & compare.

You’ll learn to really clean up your landing pattern for this.

Hope this helps!
Maybe someone else can chime in with better hints.

3 Likes

@acsbasacs
Figured since I’ve done it the easy way, and I have the jump mapped out, I could maybe illustrate.

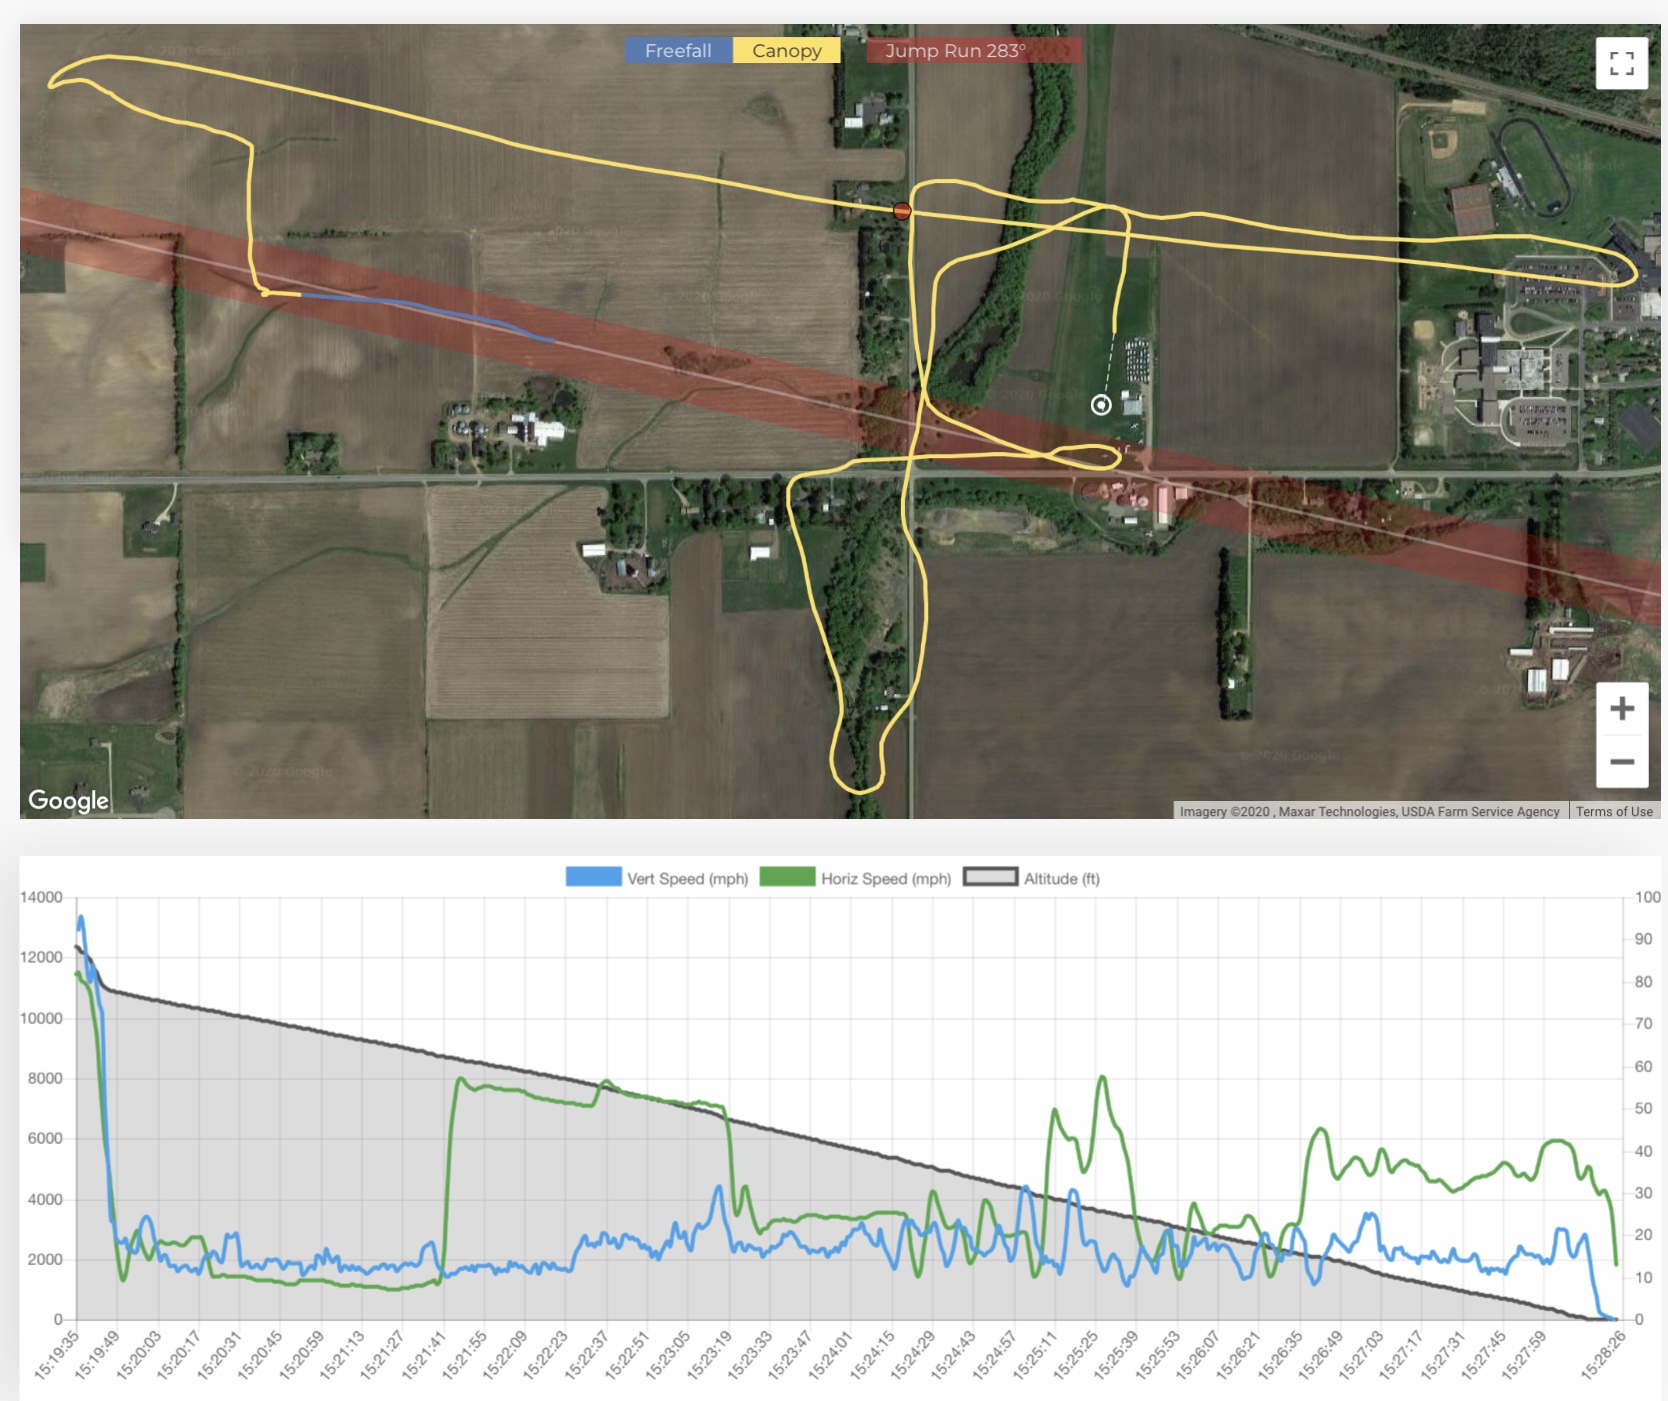
This is the view of the complete jump runway seen in Dekunu cloud web page (action).

Jumped out, deployed at around 11k, travelled east downwind with the brakes stowed, until hitting the road and unstowed the brakes, keeping straight on heading. Then a u-turn and returned back to the same road to finish the test. Makes for a good windy sample and an example of what’s in store.

Data wise, those above 3 legs are these plateaus.
image
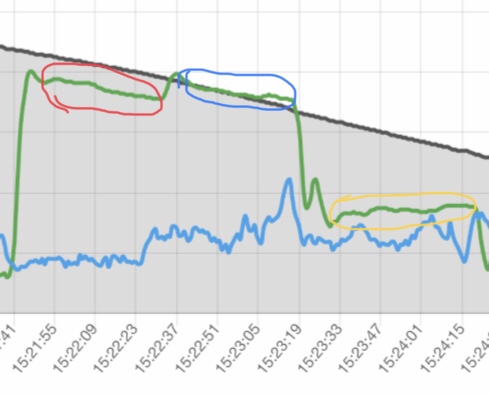
You can see that the ground speed (green line) is roughly 50-58mph, slowly but steadily dropping over time, on the two downwind legs, indicating the decline in wind speed at lower altitudes.

And, although this was all very straight flight, there is some fluctuation here & there, regardless.

Follow the graph down to the vertical speed (blue line), and you’ll see comparatively stronger variations on altitude loss. 1st leg is okay, but second leg is wild. Visually, it’s not too hard to take an educated guess as which spot on that line represents a best average.

The upwind leg runs about 24mph, ever slightly increasing, indicating still that the head wind speed is still decreasing with altitude.

A manual sample point on 1st leg
image
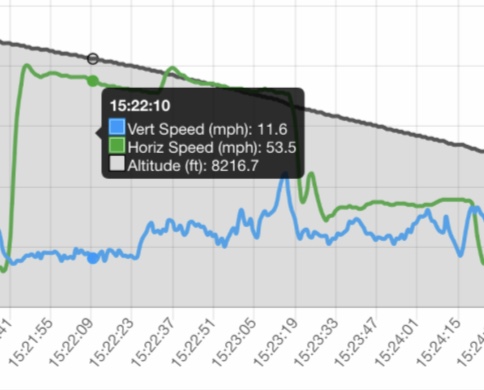
Clicking on a point on the blue line corresponding with a “visual average” …descent while brakes are stowed: 11.6mph. 53.5mph downwind, but it’s a brisk wind.

A manual sample point on 2nd leg
image
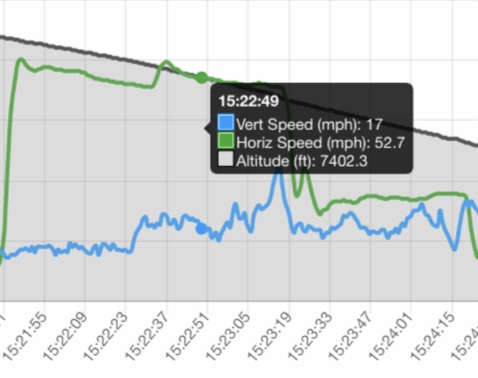
Still easy enough to make a simple guess.
17mph descent
52.7mph …say 53mph downwind.

A manual sample point on 3rd leg
image
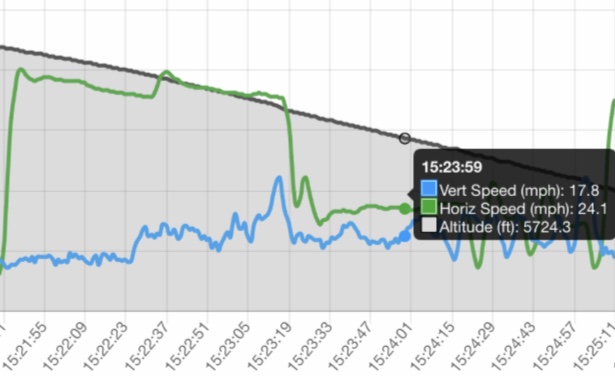
Still quite messy to choose, so any average-looking works.
17.8mph descent rate vs 17.0 … so either/or, or split the difference.
24.1 mph upwind, so, rounding to 24mph.

Canopy speed ~ (53 + 24) /2 = 37.5mph
Glide ratio ~ 2.2 (though seems higher to me)

Wind speed ~ 16mph+

Canopy speed brakes stowed looked about 5mph less, implying 30-32mph under brakes, with descent rate down to 11.6mph, is 2.6:1 to 2.75:1 glide ratio.

Conclusion
Since all the data is there, it’s easy to clean it up and get real averages, and calculate the wind speed at exact altitudes and fine tune. I never bothered. Once I saw, time & time again, how the winds fluctuated so, and how the descent rate fluctuated, I use them as simple base.

1 Like

Flysight viewer has some wind cancellation calculations that it does. You would have to export to flysight format and import it into that tool. It gets fairly complicated though and is still an estimation.

Don’t overthink landing patterns too much. It’s something you learn and adapt to. Learning how a wind sock looks at 5, 10, 15, 20+ mph is going to give you way more insight into how to build a pattern. You also have to consider winds at varying levels. It will often happen that winds at 2k feet are way different than 1k feet. That is why knowing the winds using something like https://www.markschulze.net/winds/ or windy.com is good practice. You won’t get caught off guard if you find yourself far west but there are strong winds at 2500ft out of the east and then you can make some quick adjustments.

2 Likes

Thank you! I am going to take your advice and work out the details.
I appreciate the detailed explanation.
Aaron

Thank you! I will check out flysight.
I am taking your comments to heart. Last week I jumped in strong winds for the first time. The clouds were going perpendicular to the wind sock. I had to throw-out my planned pattern to make it to the DZ.